
Trading Statistics: A Complete Guide
CLEO’s Statistics dashboard breaks down every position you take into overall performance data you can act on. The CLEO Trading Platform features the best and most detailed statistics in prop trading, giving traders an advantage over those who use a basic exchange interface.
Here we cover every metric available, what it measures, and how to read it. This is regarding the CLEO Web based Prop Trading Platform. For statistics available in the CLEO Mobile App see this.
Statistics are calculated across your full trading history unless you filter by date range, symbol, or position type (Long/Short).
To access your statistics just click the “Statistics” tab under the chart.
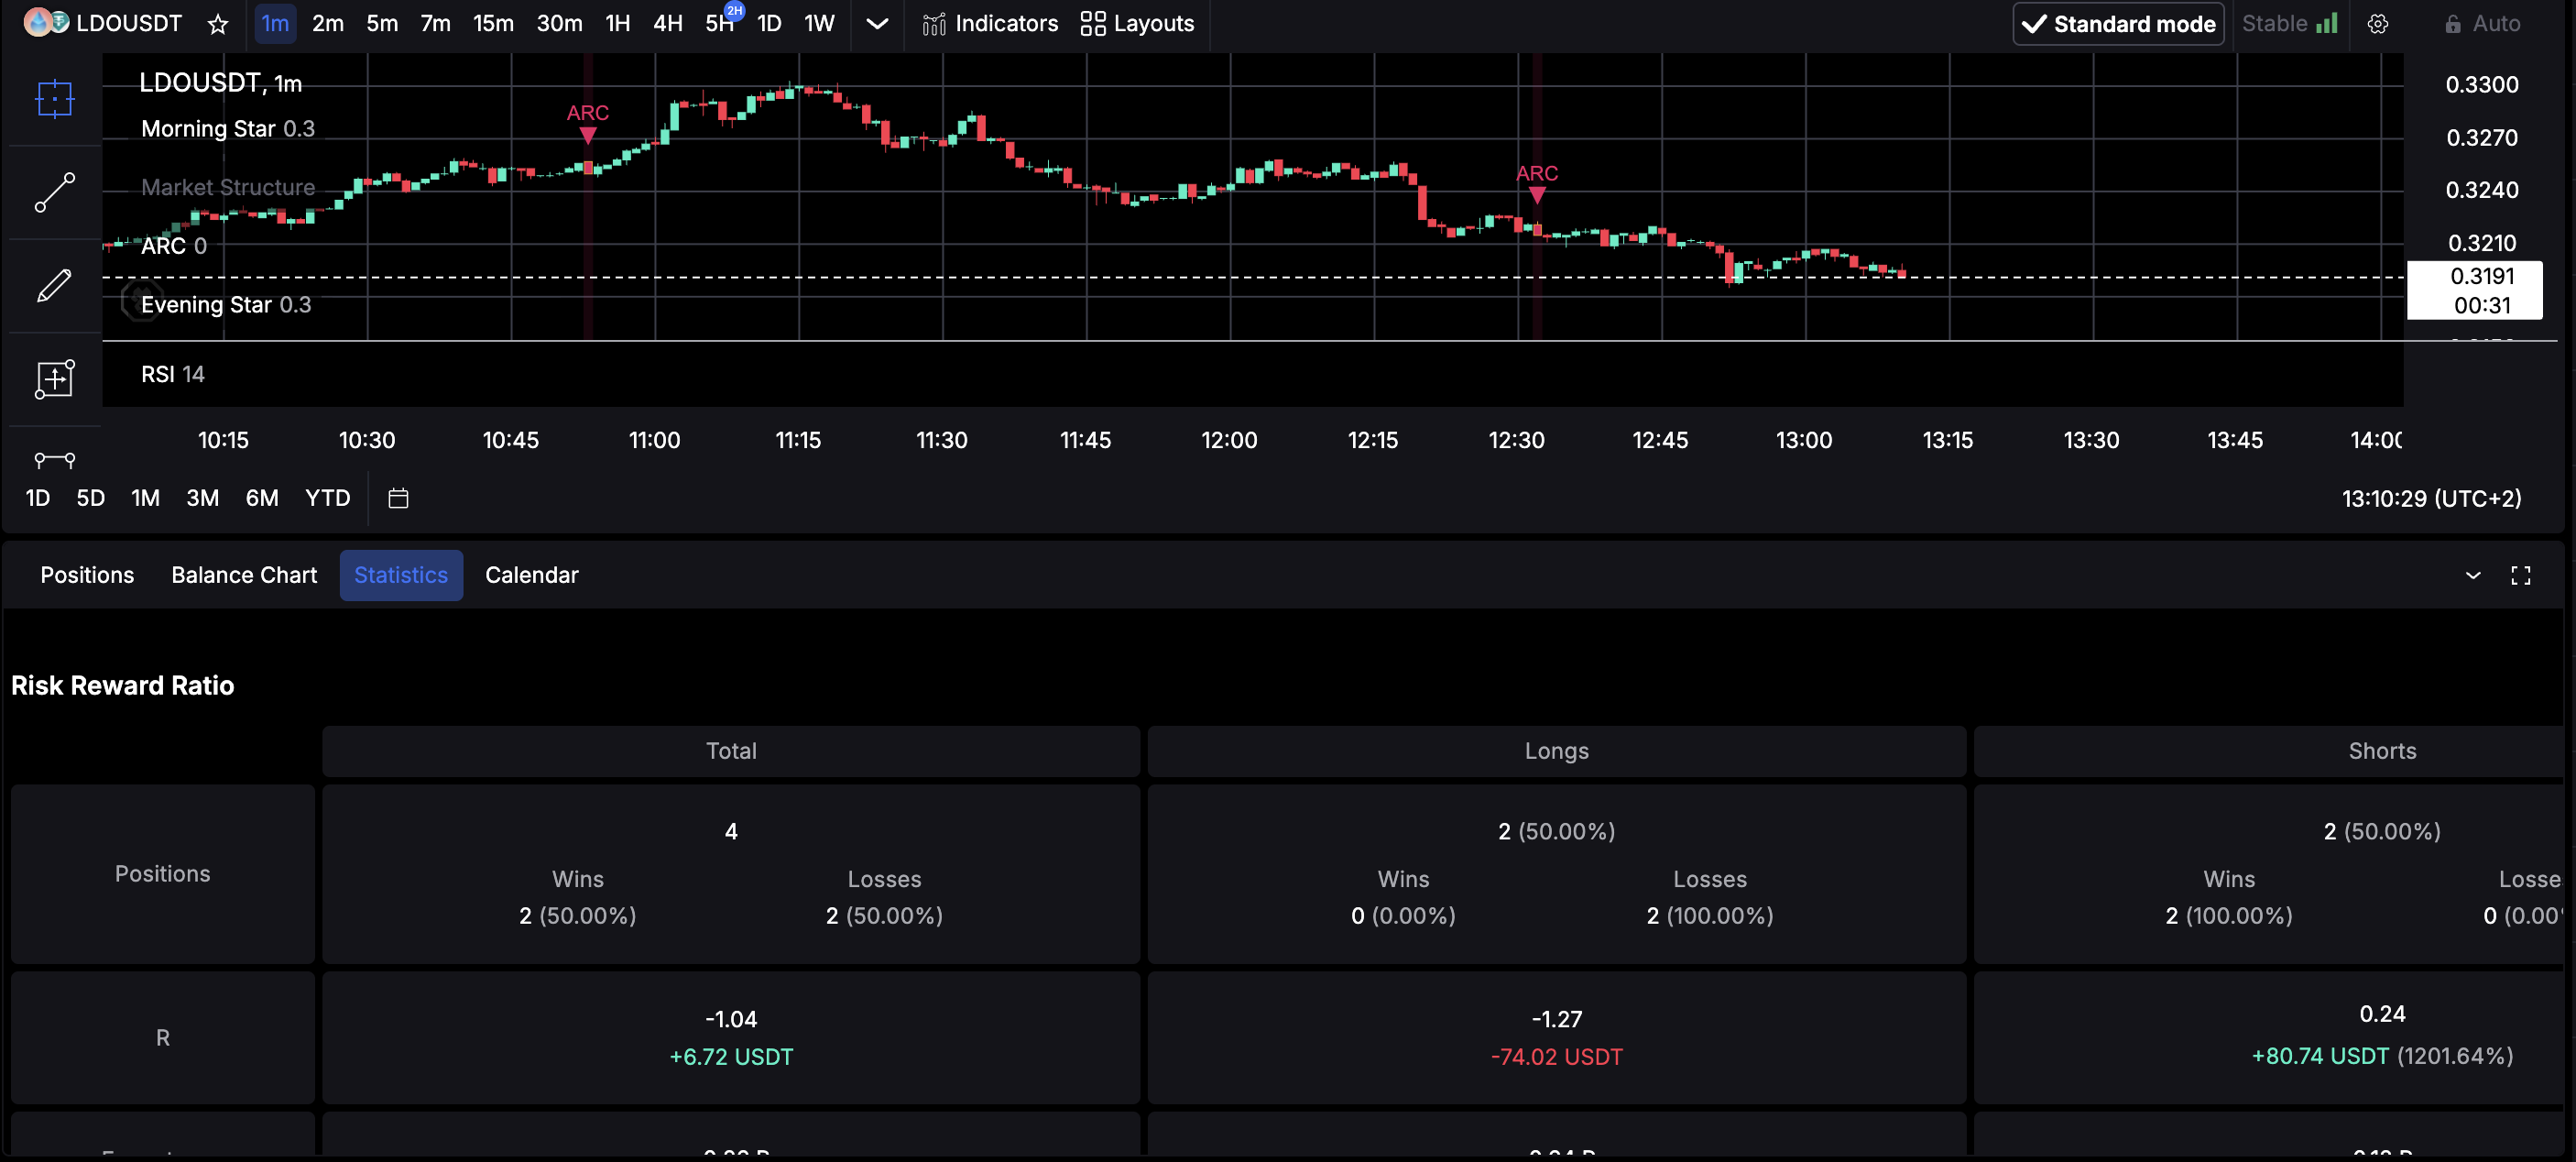 Risk Reward Ratio
This panel splits your performance across three views: Total, Longs, and Shorts.
- Positions: Total count of positions, with a Wins/Losses split and win rate percentage for each.
- R: Your total realized return expressed in R-multiples (a position’s profit or loss divided by its initial risk), alongside the USDT value. A positive R total means your winners outweighed your losers on a risk-adjusted basis.
- Expectancy (Avg. R): The average R value per trade. This is the single most useful number for judging whether your strategy has an edge — a positive expectancy means each trade you take is, on average, profitable relative to the risk taken.
Use this panel to compare whether your long or short setups carry more edge, rather than looking at raw PnL alone.
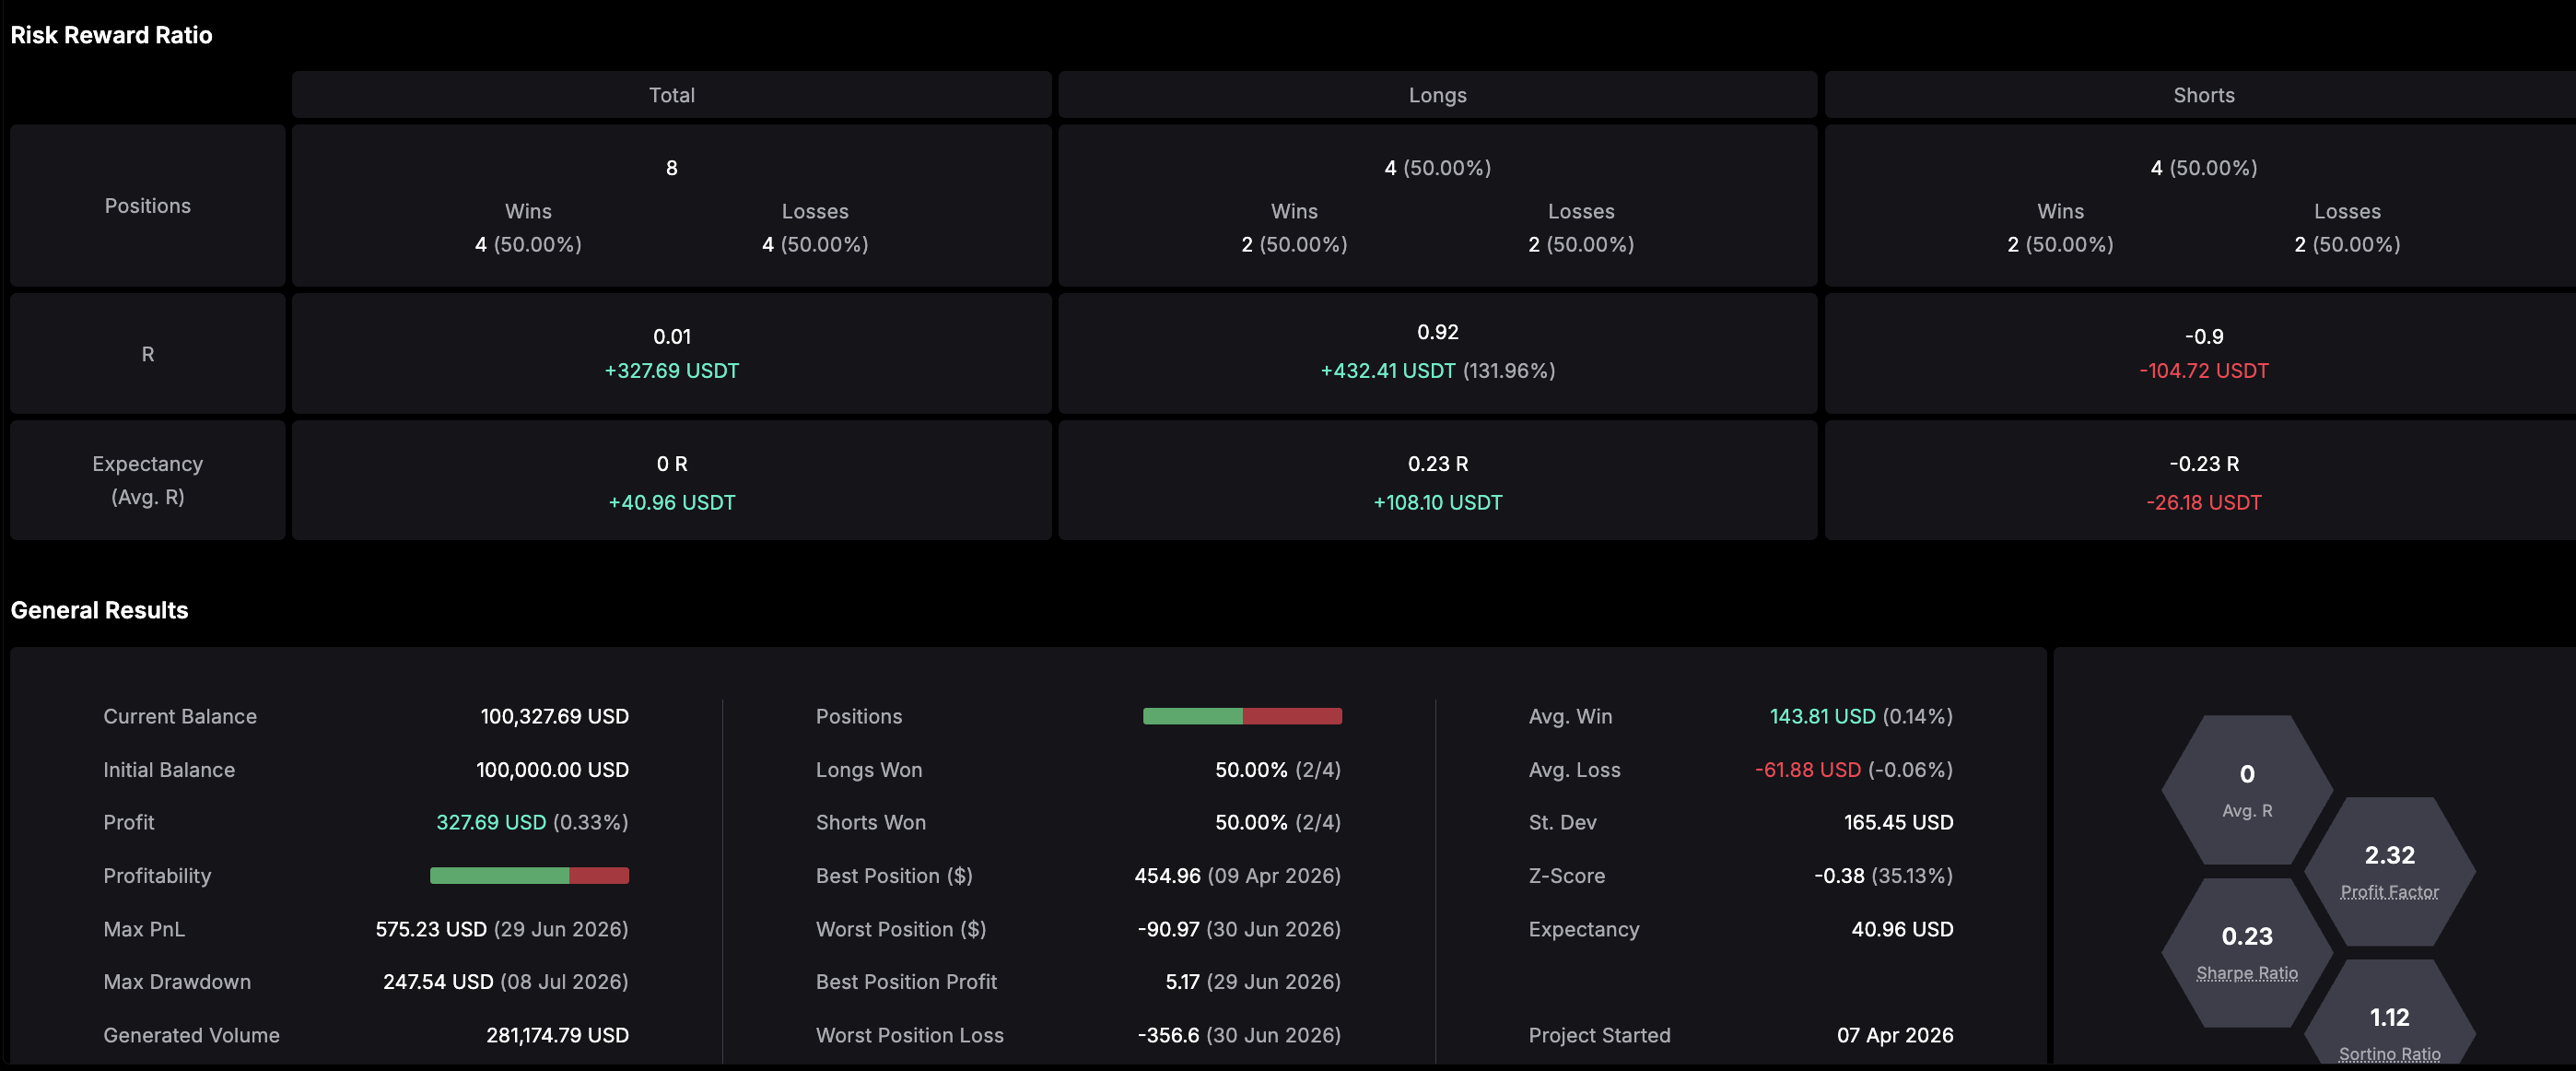 General Results
The top-level summary of account performance.
Account
- Current Balance / Initial Balance: Your account value now versus your starting capital.
- Profit: Net dollar and percentage gain since inception.
- Profitability: A visual bar showing the proportion of winning vs. losing positions.
- Max PnL: The highest unrealized/realized equity point reached, with date.
- Max Drawdown: The largest peak-to-trough decline in account equity, with the date it occurred.
- Generated Volume: Total notional value traded across all positions.
- Transaction Costs: Total fees paid across all positions.
Positions
- Longs Won / Shorts Won: Win rate for each position direction.
- Best Position ($) / Worst Position ($): Your single best and worst trades by dollar PnL, with dates.
- Best Position Profit / Worst Position Loss: The same trades expressed as a percentage of account balance.
- Avg. Position Duration: The average time a position stays open.
Averages & Distribution
- Avg. Win / Avg. Loss: Mean dollar (and %) result of winning trades vs. losing trades.
- St. Dev: Standard deviation of trade PnL — a measure of how volatile your results are from trade to trade.
- Z-Score: Measures the statistical significance of your current win/loss streak against what pure chance would predict. Values near zero suggest your streaks are within normal random variation.
- Expectancy: Average net profit per trade in dollar terms.
Performance Ratios (shown as hex tiles)
- Avg. R: Mean R-multiple across all trades.
- Profit Factor: Gross profit divided by gross loss. Above 1.0 means you’re making more than you’re losing; higher is better.
- Sharpe Ratio: Return per unit of total volatility. Higher values indicate better risk-adjusted performance.
- Sortino Ratio: Like Sharpe, but only penalizes downside volatility — a more forgiving measure since it ignores upside swings.
Timeline
- Project Started / Project Ended: The date range the statistics cover.
Positions Breakdown
Three tabs — All Positions, Winning Positions, Losing Positions —each showing the same set of fields filtered to that group: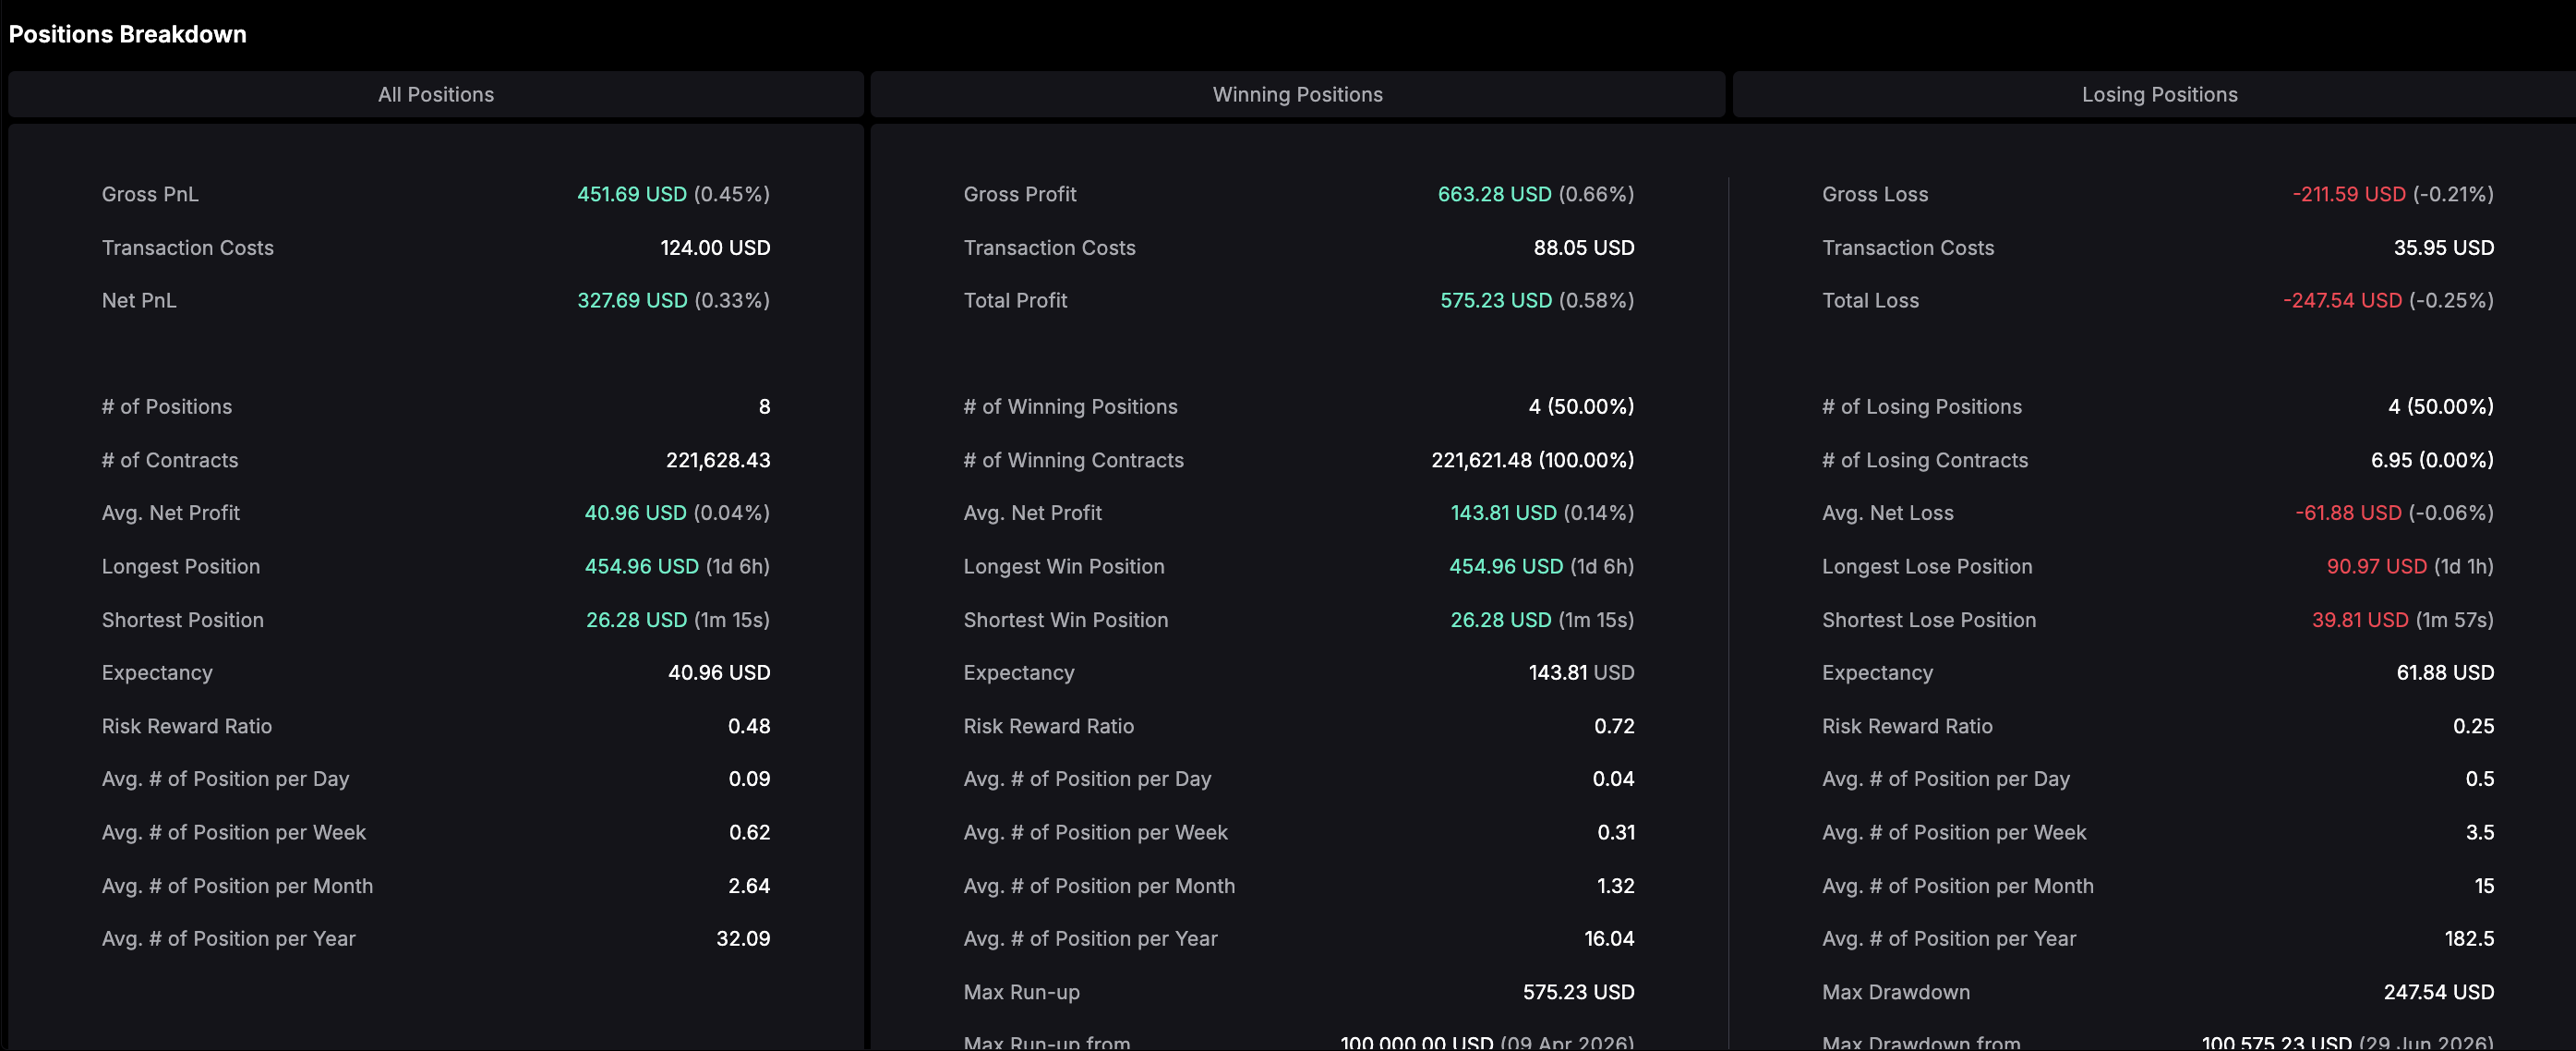 Gross PnL: Total profit/loss before fees.
- Transaction Costs: Fees paid within that group.
- Net PnL (All) / Total Profit (Winning) / Total Loss (Losing): Result after fees.
- # of Positions: Count and percentage share of total.
- # of Contracts: Total contract volume and its share of overall volume.
- Avg. Net Profit / Avg. Net Loss: Mean result per position in that group.
- Longest / Shortest Win or Lose Position: The biggest and smallest dollar outcomes, with how long each position was held.
- Expectancy: Average net result per position in that group.
- Risk Reward Ratio: Average reward relative to average risk for that group.
- Avg. # of Position per Day / Week / Month / Year: Trading frequency, annualized for context.
Max Run-up / Max Drawdown
- Max Run-up: The largest continuous equity gain, shown with the balance it ran up from and to, and the date reached.
- Max Drawdown: The largest continuous equity decline, shown the same way.
Risk to Reward (RRR) Breakdown
Risk-to-reward ratio measures the reward earned per unit of risk taken on a trade. Traders often describe individual trades as “2R” or “3R” — meaning the trade returned two or three times the amount initially risked.
This section shows:
- Best R trade: The single highest R-multiple trade, with date and value.
- Average R trade: The mean R-multiple across all trades.
- Distribution histogram: The number of trades falling into each R-value bucket (0–0.5, 0.5–1, 1–1.5, and so on), so you can see whether your edge comes from a few big winners or consistent smaller ones.
Exit Method
Shows how your positions were closed, broken into:
- Multiple Close: Position closed in stages (partial closes).
- Take Profit: Closed automatically at a TP level.
- Stop Loss: Closed automatically at a SL level.
- Manual Close: Closed manually by you.
Take Profit Hits / Stop Loss Hits: For each TP/SL level (1 through 4), this shows how many positions used that level and how often it was actually reached — expressed as a hit rate. This helps you evaluate whether your TP/SL placement is realistic or needs adjusting.
Winning Streak Counts / Losing Streak Counts
Bar charts showing the longest consecutive winning and losing streaks in your trading history, filterable by All, Long, or Short. Useful for stress-testing your risk tolerance — a 3-losing-streak, for example, tells you how much consecutive drawdown you should be prepared for.
PnL by Day of the Week / Number of Trades by Day of the Week
Two side-by-side charts, filterable by All, Long, or Short:
- PnL by day of the week: Net profit or loss generated on each day (green = profit, red = loss).
- Number of trades by day of the week: How many positions were opened on each day.
Together these reveal whether certain days are systematically better or worse for your strategy.
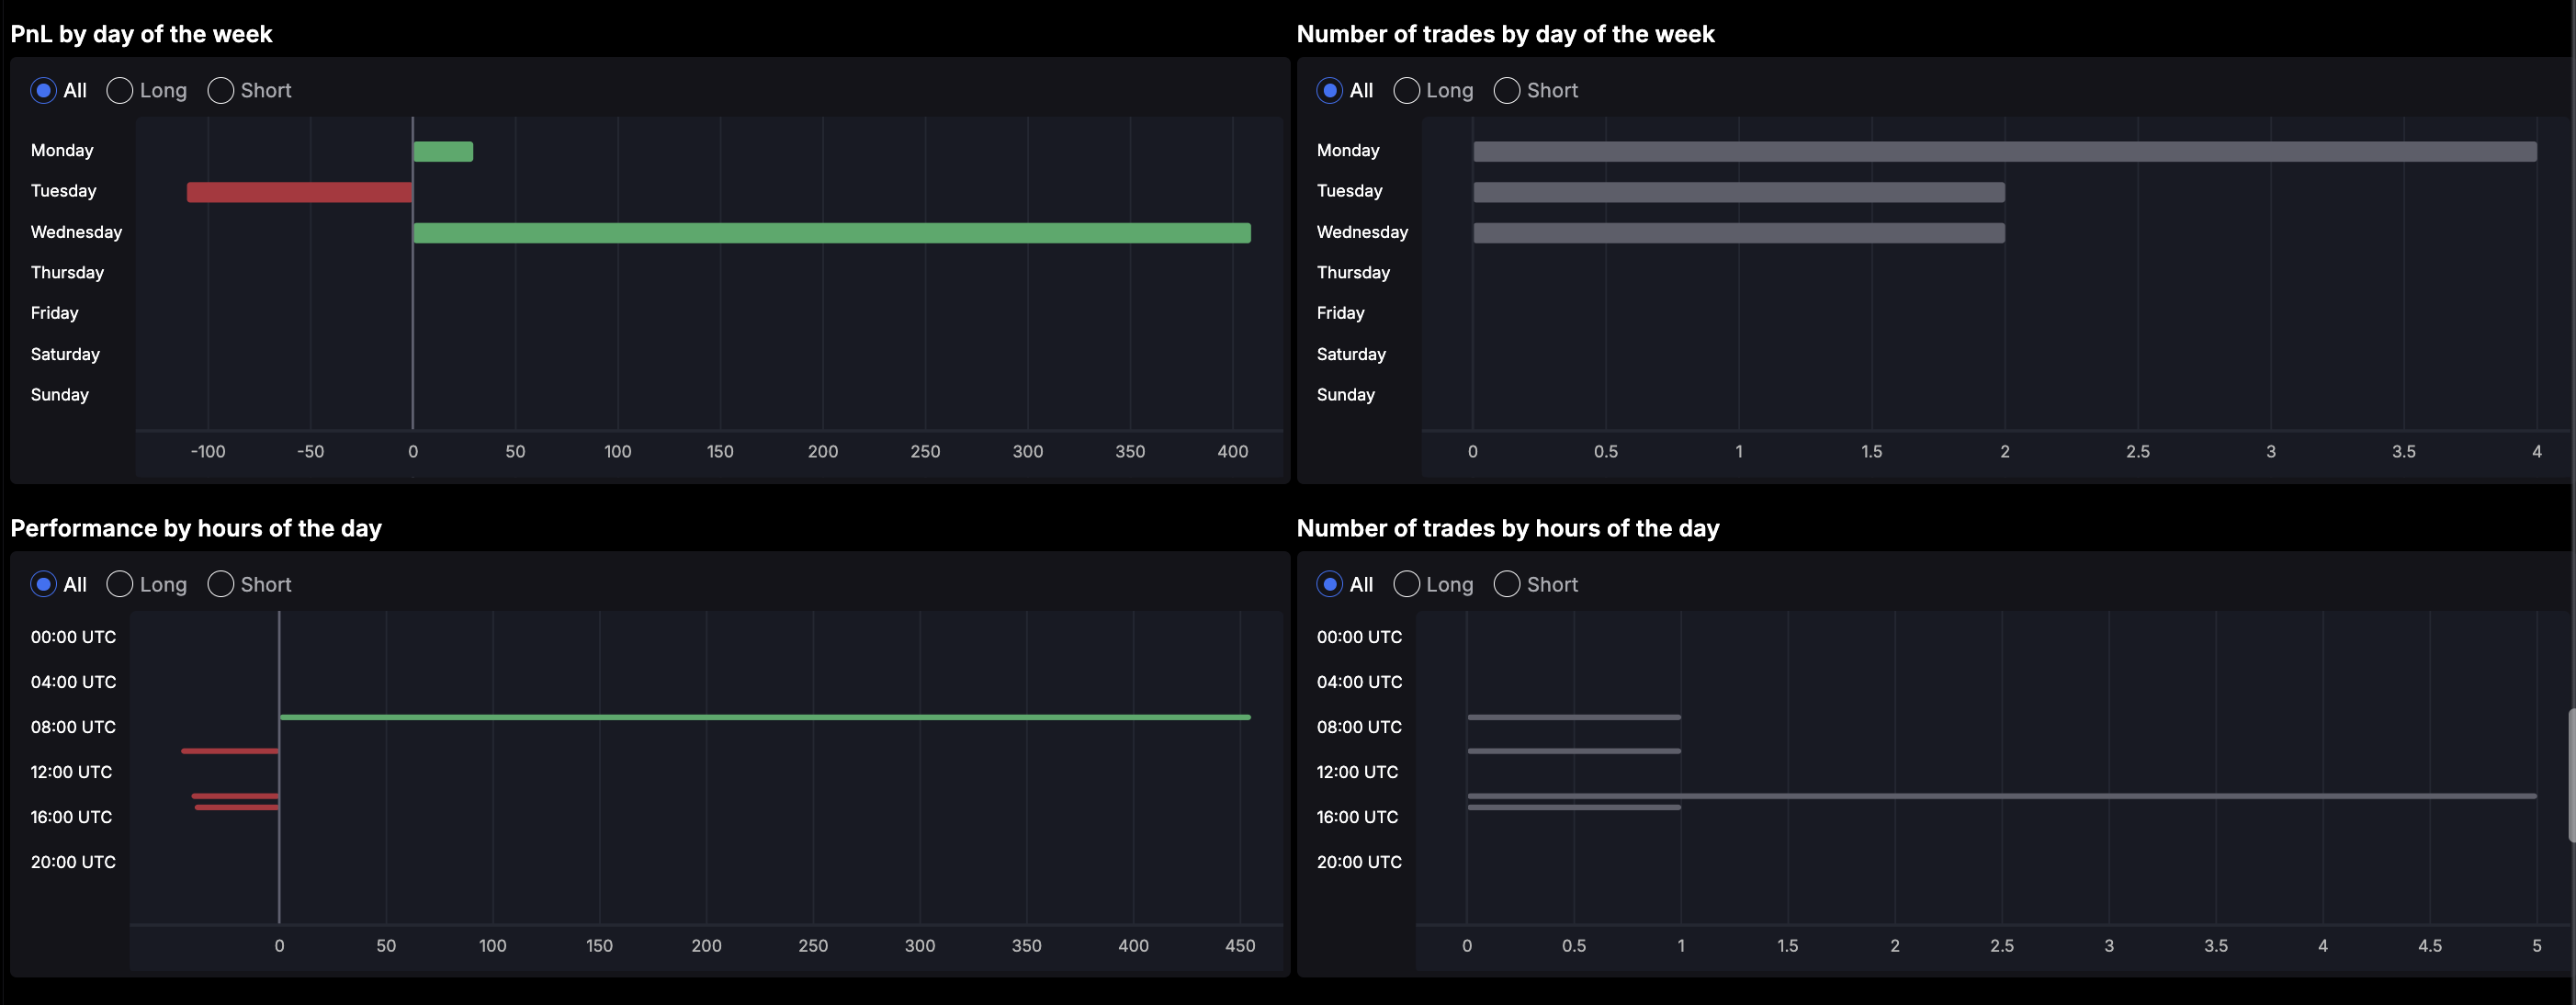 Performance by Hours of the Day / Number of Trades by Hours of the Day
Same concept, broken down by UTC hour instead of day. Useful for identifying which sessions (Asia, London, New York) align with your best results, and whether your trade frequency is concentrated in low-liquidity hours.
Best 5 Trades / Worst 5 Trades
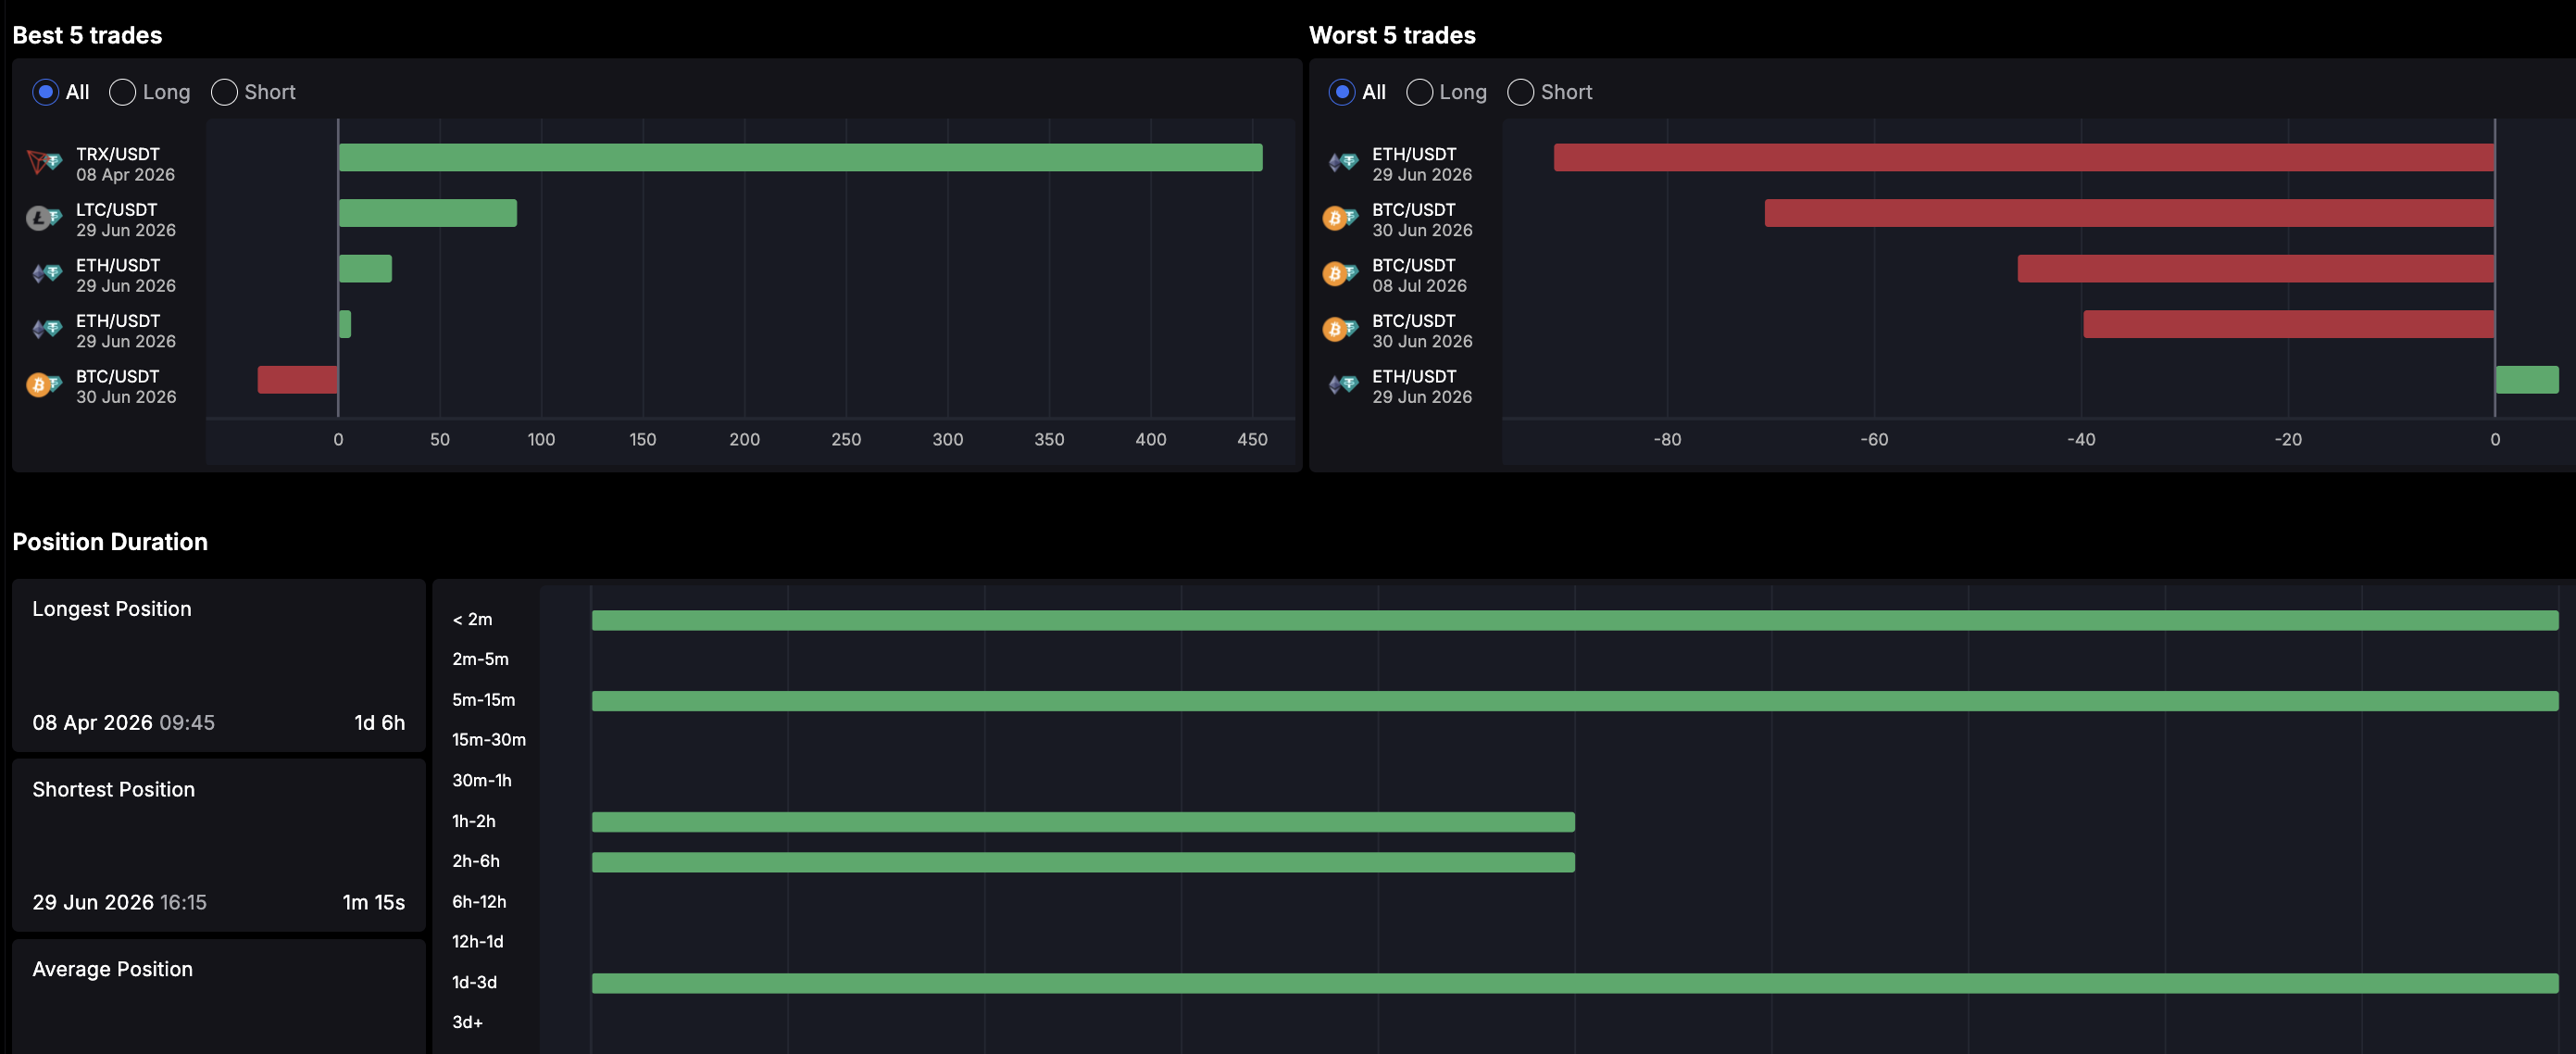
Ranked lists of your five most profitable and five least profitable positions, showing the symbol, date, and dollar result for each. A quick way to spot whether outsized wins or losses are skewing your overall statistics.
Position Duration
- Longest Position / Shortest Position / Average Position: Headline duration stats with dates.
- Duration histogram: Number of positions falling into each holding-time bucket, from under 2 minutes up to 3+ days. This shows whether your strategy is scalp-driven, swing-driven, or mixed.
 Risk of Ruin
This section models how transaction costs and loss size affect account survivability.
- Transaction costs are defined as the difference between Gross PnL and Net PnL, shown both in dollars and as a percentage of Gross PnL.
- The Loss size / Probability of loss table shows, for a range of hypothetical loss sizes (10% to 100% of account), the modeled probability of experiencing a loss of that magnitude based on your historical trade distribution.
Use this to sanity-check whether your position sizing leaves enough margin for a bad run without risking account ruin.
Quick Reference: Where to Look First
| Question | Section |
|---|---|
| Is my strategy actually profitable per trade? | General Results → Expectancy, Profit Factor |
| Am I better at longs or shorts? | Risk Reward Ratio split by Longs/Shorts |
| Are my TP/SL levels realistic? | Exit Method |
| What’s my worst-case losing streak? | Losing Streak Counts |
| When should I be trading? | Performance/Trades by Hours & Day |
| How exposed am I to a big drawdown? | Risk of Ruin, Max Drawdown |