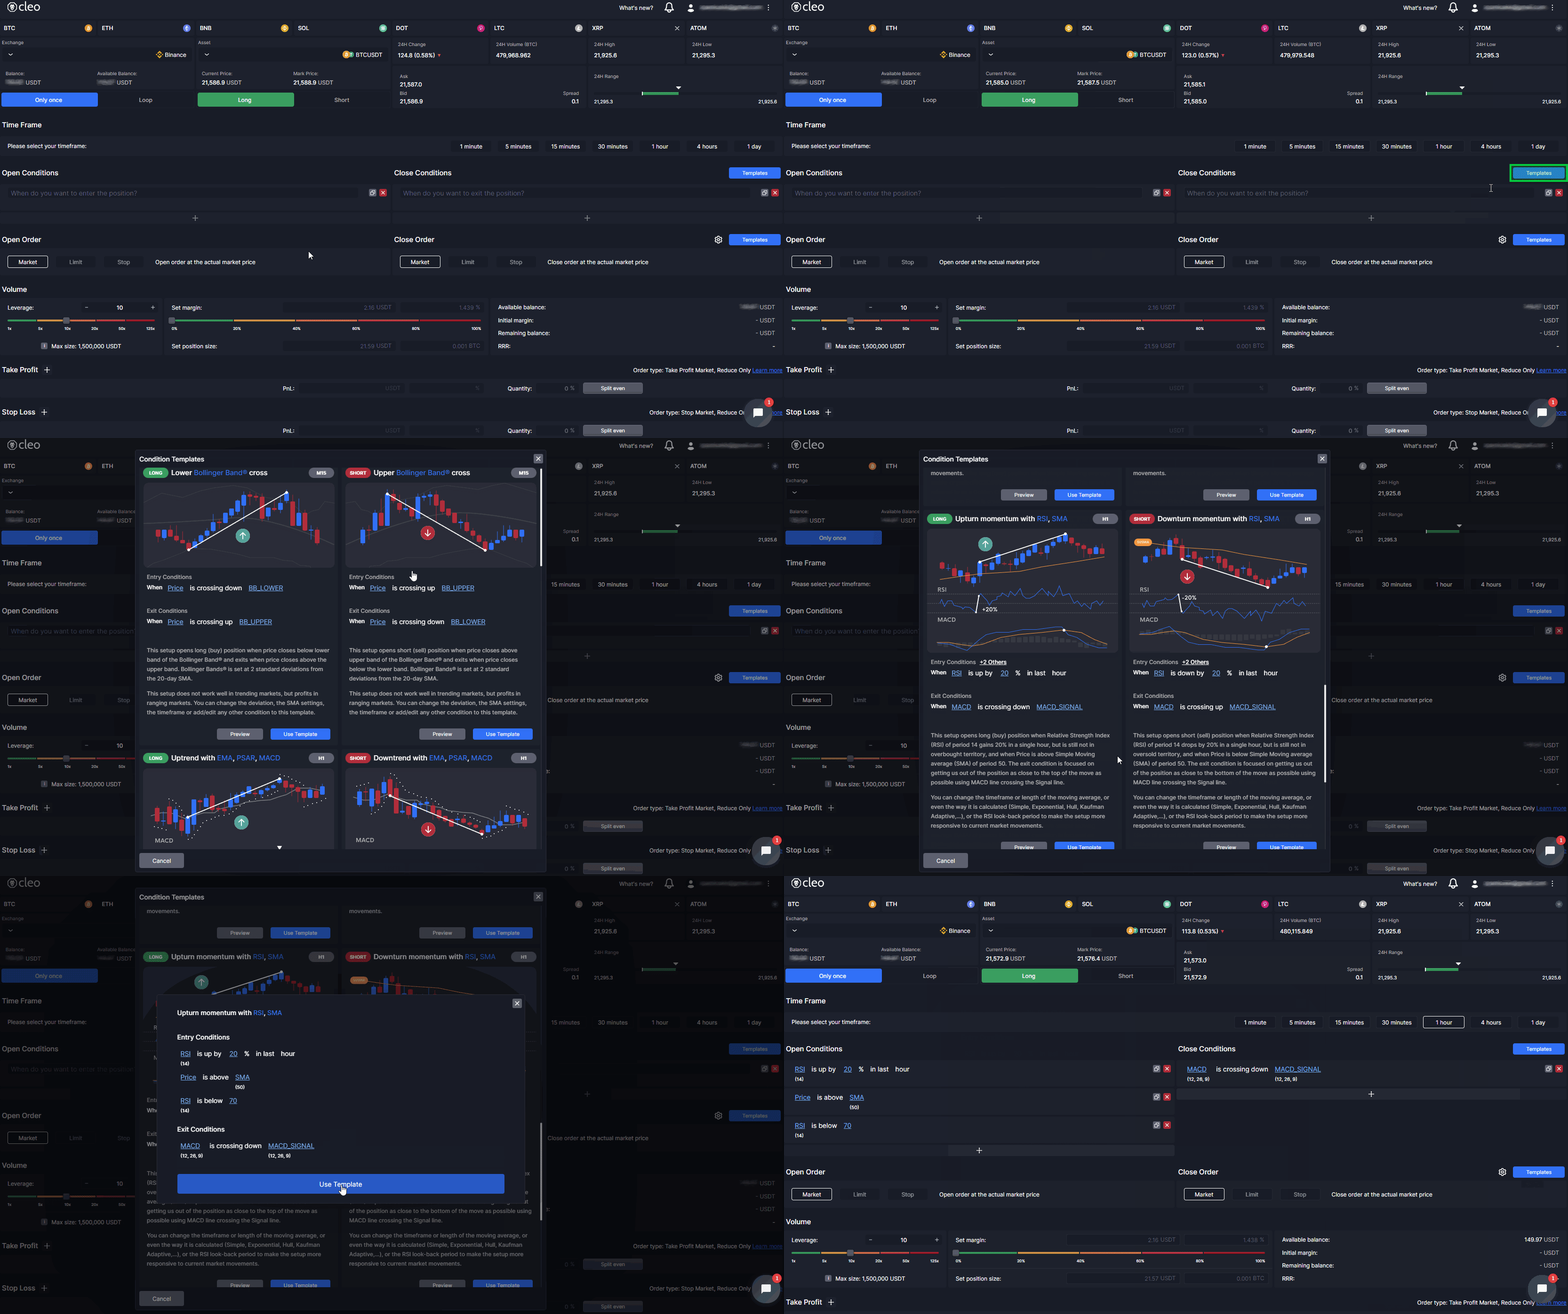
Cleo Trading Platform has conditions templates available. In this section, we will be touching upon those templates. What are those conditions templates? Where you can find them? How to use them? and more?
There are 10 conditions templates available for you to use. You can preview them, use them and even customize them in any way you like.
You can use the conditions templates with just a simple click. All you need to do is click the button called “Templates” on the right upper corner of the creating conditions section.

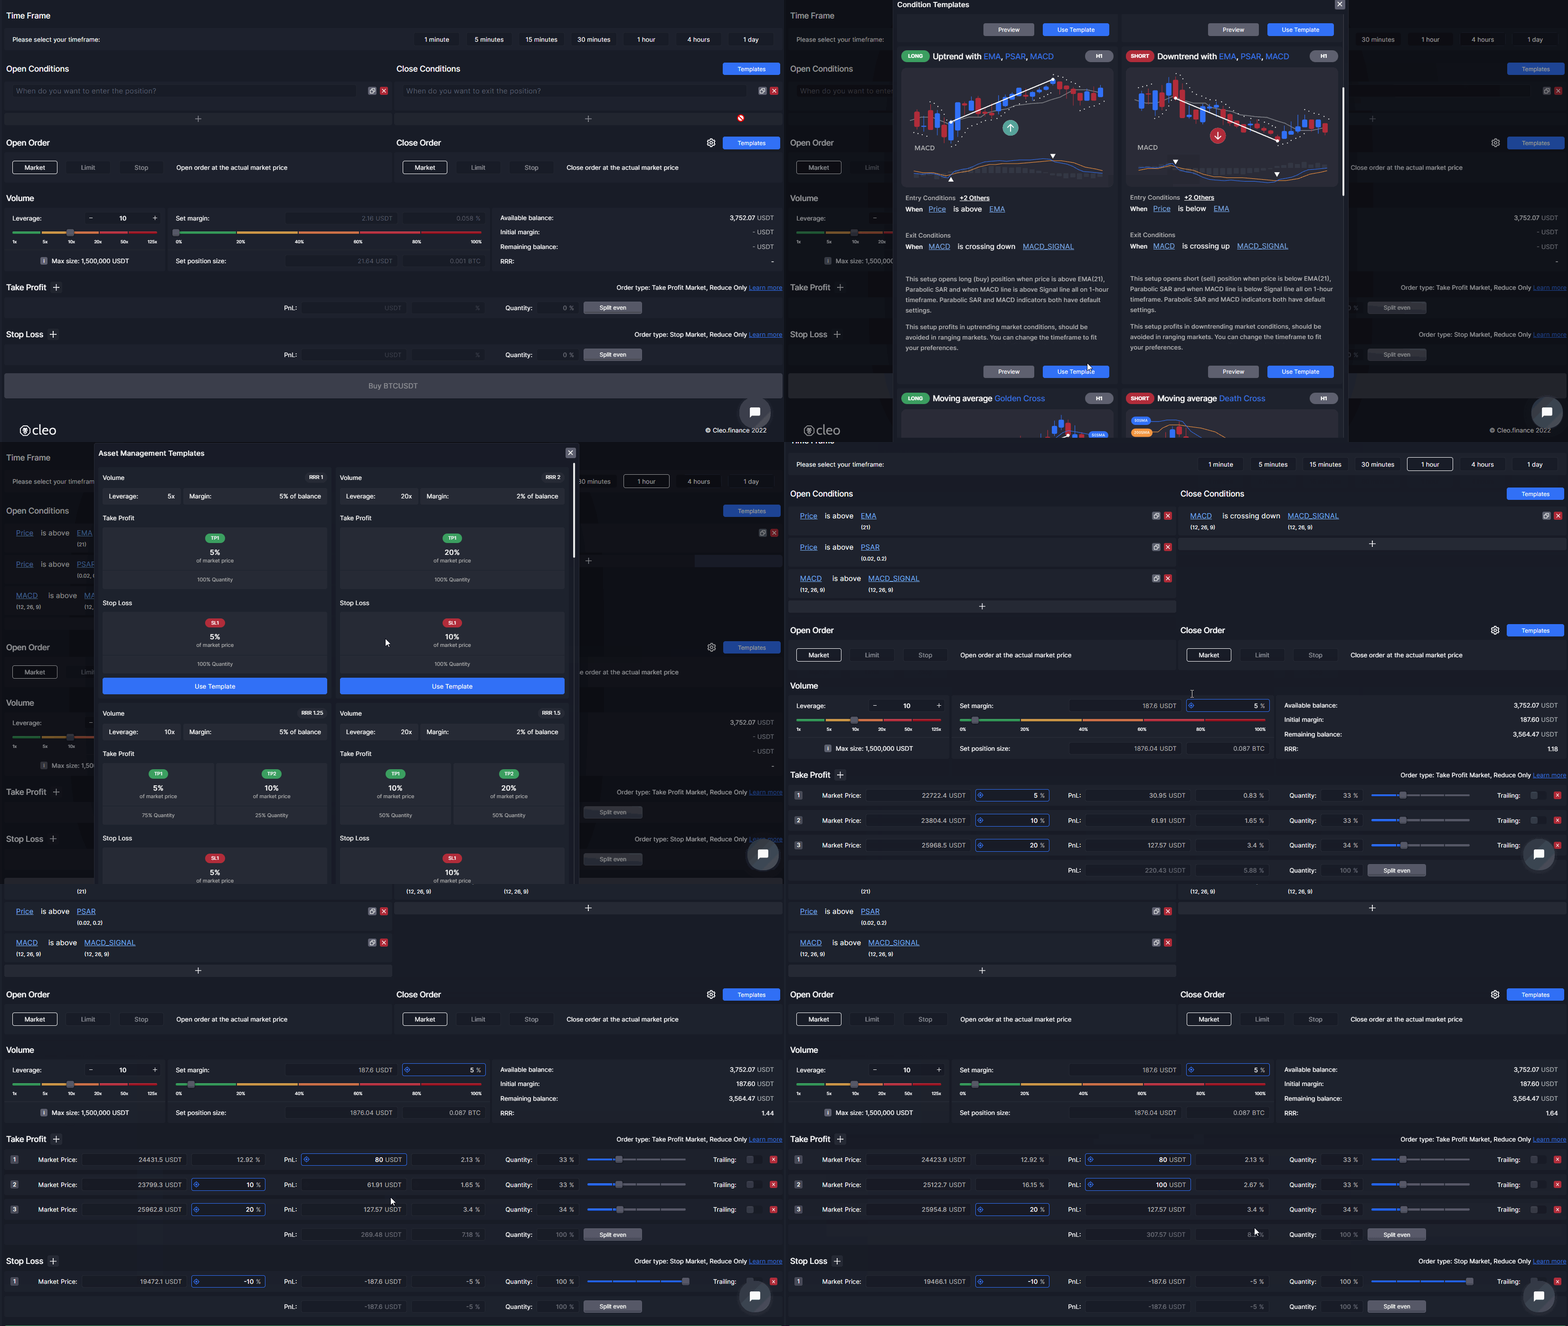
You are also able to use conditions templates together with the templates we have on Asset Management. If you would like to see the information on Asset Management templates, please click here.
Here is an example on how to use them together:

There are 10 conditions templates in total. Here we will be mentioning each of them one by one.
1. Lower Bollinger Band® cross

This setup opens long (buy) position when price closes below lower band of the Bollinger Band® and exits when price closes above the upper band. Bollinger Bands® is set at 2 standard deviations from the 20-day SMA.
This setup does not work well in trending markets, but profits in ranging markets. You can change the deviation, the SMA settings, the timeframe or add/edit any other condition to this template.
2. Upper Bollinger Band® cross

This setup opens short (sell) position when price closes above upper band of the Bollinger Band® and exits when price closes below the lower band. Bollinger Bands® is set at 2 standard deviations from the 20-day SMA.
This setup does not work well in trending markets, but profits in ranging markets. You can change the deviation, the SMA settings, the timeframe or add/edit any other condition to this template.
3. Uptrend with EMA, PSAR, MACD

This setup opens long (buy) position when price is above EMA(21), Parabolic SAR and when MACD line is above Signal line all on 1-hour timeframe. Parabolic SAR and MACD indicators both have default settings.
This setup profits in uptrending market conditions, should be avoided in ranging markets. You can change the timeframe to fit your preferences.
4. Downtrend with EMA, PSAR, MACD

This setup opens short (sell) position when price is below EMA(21), Parabolic SAR and when MACD line is below Signal line all on 1-hour timeframe. Parabolic SAR and MACD indicators both have default settings.
This setup profits in downtrending market conditions, should be avoided in ranging markets. You can change the timeframe to fit your preferences.
5. Moving average Golden Cross

This setup opens long (buy) position when Simple Moving average (SMA) of period 50 is crossing up SMA of period 200. This event is referred to as a Golden Cross. The exit conditions are set up to be faster: when Price is crossing down SMA(50).
You can change the timeframe or length of each moving average, or even the way it is calculated (Simple, Exponential, Hull, Kaufman Adaptive,…) to make the setup more responsive to current market movements.
6. Moving average Death Cross

This setup opens short (sell) position when Simple Moving average (SMA) of period 50 is crossing down SMA of period 200. This event is referred to as a Death Cross. The exit conditions are set up to be faster: when Price is crossing up the SMA(50).
You can change the timeframe or length of each moving average, or even the way it is calculated (Simple, Exponential, Hull, Kaufman Adaptive,…) to make the setup more responsive to current market movements.
7. Upturn momentum with RSI, SMA

This setup opens long (buy) position when Relative Strength Index (RSI) of period 14 gains 20% in a single hour, but is still not in overbought territory, and when Price is above Simple Moving average (SMA) of period 50. The exit condition is focused on getting us out of the position as close to the top of the move as possible using MACD line crossing the Signal line.
You can change the timeframe or length of the moving average, or even the way it is calculated (Simple, Exponential, Hull, Kaufman Adaptive,…), or the RSI look-back period to make the setup more responsive to current market movements.
8. Downturn momentum with RSI, SMA

This setup opens short (sell) position when Relative Strength Index (RSI) of period 14 drops by 20% in a single hour, but is still not in oversold territory, and when Price is below Simple Moving average (SMA) of period 50. The exit condition is focused on getting us out of the position as close to the bottom of the move as possible using MACD line crossing the Signal line.
You can change the timeframe or length of the moving average, or even the way it is calculated (Simple, Exponential, Hull, Kaufman Adaptive,…), or the RSI look-back period to make the setup more responsive to current market movements.
9. Upward Momentum

This simple setup opens long (buy) position when Price makes at least 1% move up within a single hour. The exit condition is set for a bearish Hanging Man Candle, but it is strongly suggested to pair this template with layered Asset Management strategy – with multiple Take Profit orders.
10. Downward Momentum

This simple setup opens short (sell) position when Price makes at least 1% move down within a single hour. The exit condition is set for a bullish Hammer Candle, but it is strongly suggested to pair this template with layered Asset Management strategy – with multiple Take Profit orders.